The universal primary metric of business performance is profit. If you knew how much cash your shop generated in a day and also knew how much cash your shop burned in a day, you would know how much profit you made that same day. With simple metrics like this, you can track your progress during the month and begin to predict your P&L for the month. This certainly beats waiting until the 10th of next month for your accountant to tell you how this month worked out.
The benefit of this approach is you can run your business in a proactive looking-through-the-windshield manner instead of the traditional driving-while-looking-in-the-rearview-mirror mode.
The essence of countertop fabrication is this: Raw materials come into the plant, a miracle occurs, and a finished product goes out of the plant. The market sets both the price you pay for materials (slabs) and the price you receive for your installed tops (if you don’t agree, try selling your tops for $1000/ sq ft). Subtracting the material cost from the selling price equals the value that the market places on the miracle that occurs in your fab shop.
(If you contract out templating and/or installation, then subtract these costs from the sales price as well.)
It looks like this:
$Sales price – $Material cost = $Value added
Since this calculation shows material and contract costs as essentially a pass-through, then $Value Added is the cash the business generates. We call this Throughput Dollars ($T).
To calculate our profit every day rather than every month, there’s another financial factor that is important. If we think of the business like a machine that generates cash, then there is a cost to turn the crank. This includes all productive labor and all overhead costs – insurance, rent, maintenance, office labor, etc. This is the cash the business burns and we call it Operating Expense ($OE).
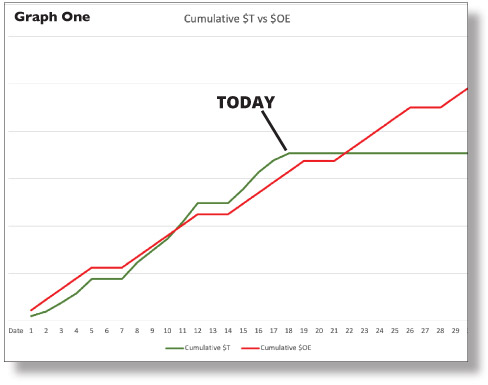
Since $T is the cash the business generates and $OE is the cash the business burns, then $T – $OE = Profit. With these simple metrics, you can calculate your profit every day and begin running your business much more proactively.
Here are the steps to implement these metrics:
- Gather the last 3-4 months of P&Ls and calculate $OE(operating expense) for each month. Average the $OE for those months. Divide the average by 20 (typical number of working days in the month). This gives you the daily $OE or the amount of cash your business burns each day.
- Calculate the $T for each order.
- Each morning add up the $T for each FULLY COMPLETED job from the previous day. Do NOT score $T for any job that is not totally and fully complete.
- Subtract your daily $OE rate from the $T for that day and you will know how much profit you made that day. It’s really that simple.
- If you track and graph these numbers every day (see example Graph One), you can easily see if you are making a profit for the month or not. If you are reading this article early in the month, go ahead and graph this information to see how your month is progressing so far.
- As performance of your plant stabilizes, you can use your sales backlog (jobs sold and ready to be templated) to get a very close estimate of what your P&L will look like before the month is over. This allows you to be proactive in running your business and you can make better decisions to improve your profitability!

These metrics can also help you make better decisions on which changes to make for your business. We discussed Value Added and Non-Valued Added tasks in the February Slippery Rock article. With these metrics you can now put dollar values on the Value Added and Non-Value-Added tasks in your shop. This will help you make decisions like:
- This more expensive CNC tooling certainly increases my $OE. How much will it increase my $T?
- I think I need a helper on the shop floor so my SawJet won’t be a bottleneck and I can keep the constraint at Install. I know this will increase my $OE. How much will it increase my $T?
- It will take a little time and money to install a high-flow washdown to decrease cleaning time (NVA) for my CNC tables because work tends to bottleneck there. How much time will it free up and what does that mean in $T?
In the March Slippery Rock article, we asked the question: How much profit do you plan to make next Thursday? By tracking the metrics in this article, you can now dial in scheduling so that you are planning enough installs to allow you to make a profit every day.
As a fab shop owner, you deserve to have a business that makes you money and also allows you the time to enjoy it.
To find out more about how to make more money and get your life back, email me at Ed@FabricatorsCoach.com.
